

OTW #46: Predicting volatility, More data revisions, Job growth, and more.
OTW #46: Predicting volatility, More data revisions, Job growth, and more.
Important financial stories to check out over the weekend
Hi Antagonist readers,
Welcome to another edition of “Over the Weekend.” If you enjoy these posts, please invite others to subscribe. When your referrals sign up, you’ll receive credits that reward you with a free premium membership!
1. Predicting stock market volatility.
is a master at identifying and interpreting leading indicators. He recently posted this thread that explains how the Utilities sector of the S&P 500 is a powerful indicator of stock market volatility.When investors flock to Utilities, it’s often because they’re seeking stability amidst uncertainty. This sector’s outperformance can signal a lack of confidence in the broader market, leading to increased volatility.
Gayed says that when Utilities outperform the S&P 500, investors should consider rotating into lower-volatility stocks to potentially avoid losses during a market downturn.
Conversely, when Utilities underperform the market, it may signal a return to more stable conditions. This can be an opportunity to rotate back into higher-beta stocks to capitalize on potential gains.
Antagonist’s take
Gayed’s thread is based off his award-winning research paper, “An Intermarket Approach to Beta Rotation: The Strategy, Signal, and Power of Utilities.”
He also publishes the Lead-Lag Report, which I highly. recommend. Gayed regularly shares robust research on leading indicators and other trends. He’s even offering a 50% discount right now. You can subscribe here.
2. More data revisions by the government.
Last week, I explained that the slowdown in inflation was at least partially due to the government changing the way it calculates data. That story focused on health insurance costs.
That’s not the only adjustment that the government has made, however.
Peter Tarr regularly posts about government data revisions, which often significantly differ from its original numbers.
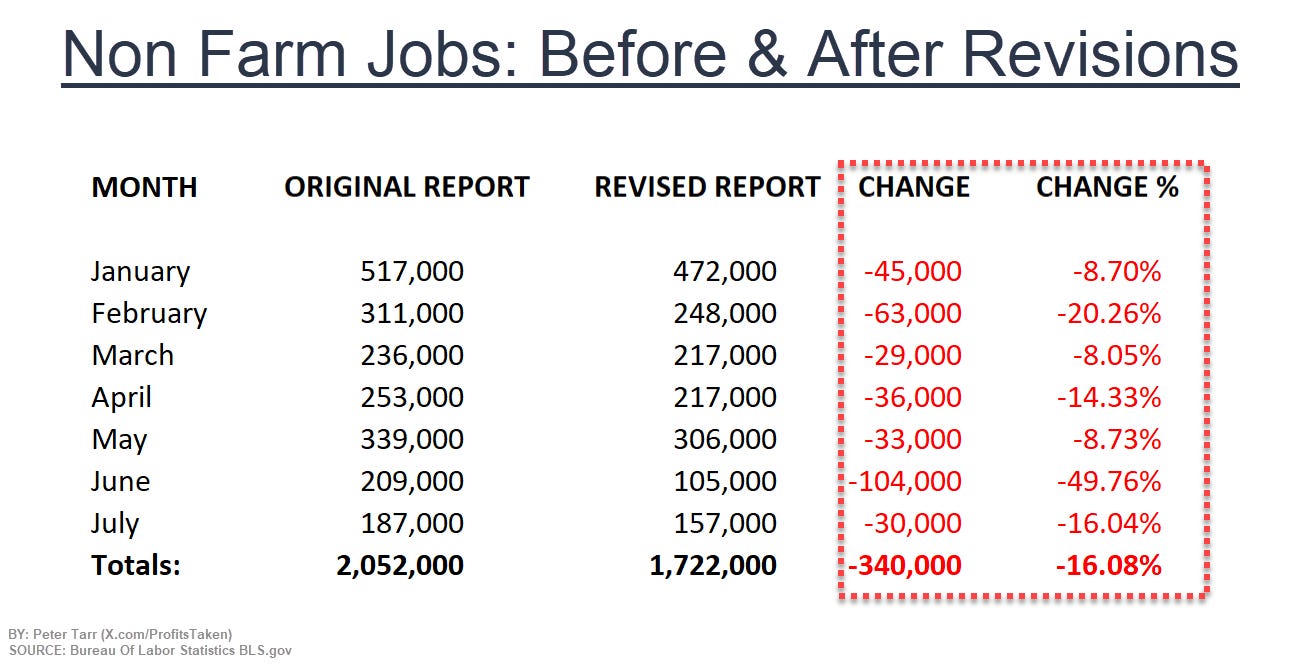
Here are his comments on the latest job data:
Last week’s jobless claim was revised to show more people filing jobless claims and the seasonal adjustment on this week’s report puts jobless claims 29.67k lower than the unadjusted data.
Source: Peter Tarr citing this Dept. of Labor news release.
Revisions and seasonal adjustments are common. This year has been interesting, however, because the revisions have largely trended in the same direction.
Last September, Tarr showed how every jobs report up to that point in 2023 had been revised down. This means that there were 340,000 (-16.08%) fewer jobs than initially reported.
Antagonist’s take
Government data can and does move the stock market. These swings are almost always emotion-based, however. Even worse, the reports often lead to wild speculation like, “Rate hikes are over!” or “It’s going to be a soft landing!”
The problem, however, is that government data is notoriously lagging, and even worse, misleading.
As I wrote last week, government officials can simply change their reporting methodology to sway the numbers in one direction or another.
Also, policy makers are far removed from the real world and the economy that you face every day. As a result, you’re able to notice changes in prices, jobs, housing, etc. much faster and more accurately than the people who write these reports.
My point is that when you make investment decisions, do not blindly trust any government report. Dig into the numbers to see what actually drove the changes, and weigh that information based on what you see happening in real time, in the real world. One of my goals with The Antagonist is to help you do just that.
3. A different perspective on job growth.
Speaking of digging into government numbers, Lakshman Achuthan, co-founder of ECRI, provided a great example of this during an episode of MacroVoices.
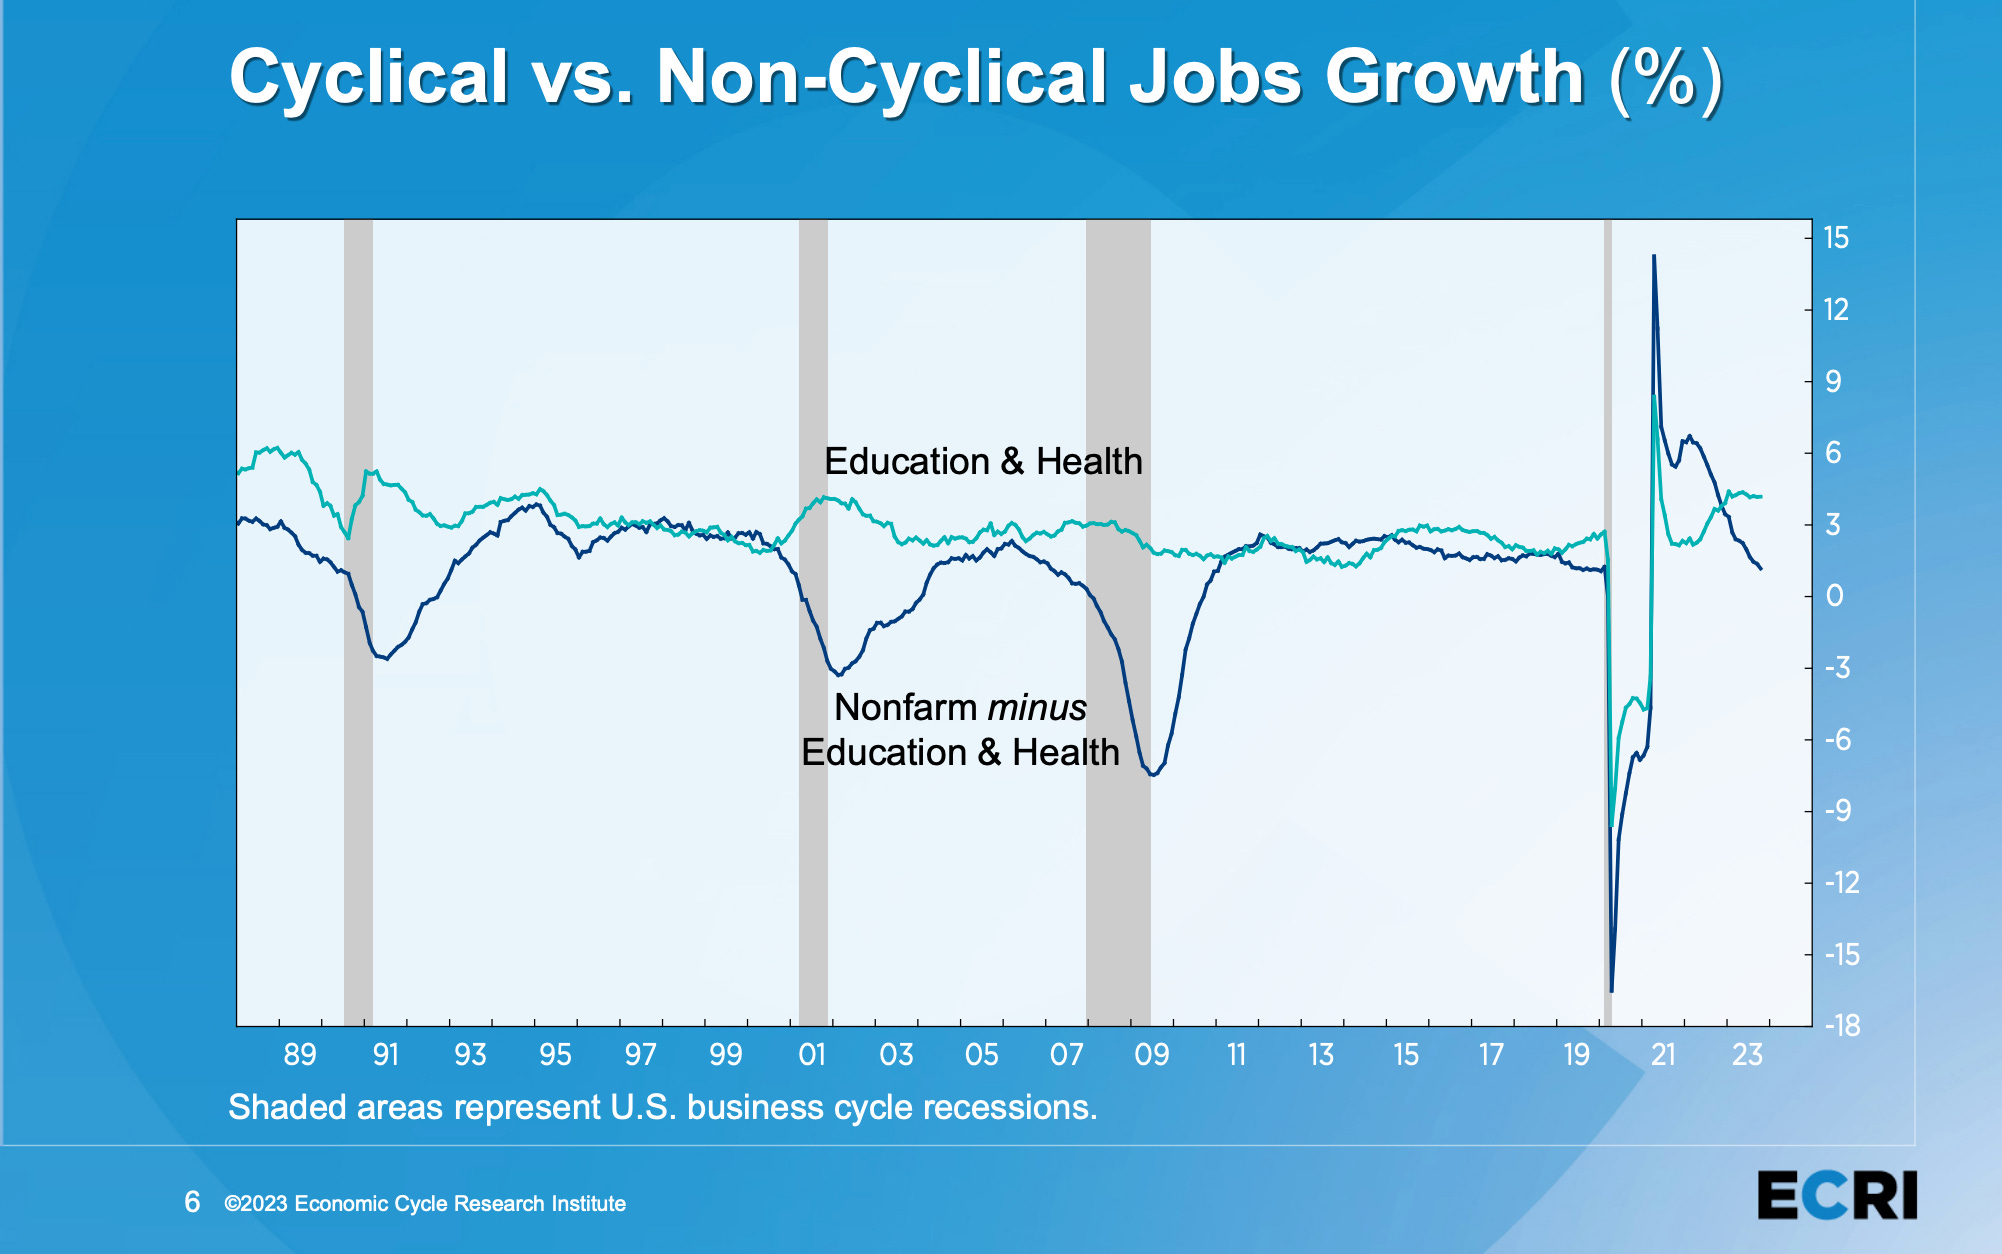
Achuthan divides job growth into two categories: discretionary and non-discretionary. He puts education and healthcare in the latter group because those jobs tend to hold up even during recessions. After all, kids still need to go to school, and people still get sick regardless of the economy.
Therefore, Achuthan prefers to look at job growth minus education and healthcare. When you do that, you’ll see that job growth (dark blue line) is falling fast:
Antagonist’s take
Achuthan notes that this decrease in non-discretionary job growth is a leading indicator for recessions (shaded areas in the chart).
While I won’t be surprised if we enter a recession (or if we’re in one now), I’m also keeping an eye on the stock market in the near term.
As crazy as it sounds, slow employment growth has been bullish for stocks this year. That’s because investors believe that if the job market cools, it will motivate the Fed to end its rate hikes, or even cut them.
Therefore, we may see a short-term rally in stocks even if we enter a recession.
Last thing...
To limit the length of Over the Weekend to 5 minutes, I can only highlight a few stories.
If you’d like to receive more summaries and links to important events and data,
follow my personal X (Twitter) account and The Antagonist.
Thank you for reading, and have a great weekend!
Jason Milton
X (formerly Twitter) | LinkedIn | Facebook | Instagram | Medium
P.S. If you enjoyed this edition of Over the Weekend, please hit the heart button at the bottom of this message and share this post with others!